

If you are studying statistics, reading a research paper, working with data, or solving a statistics problem, you will come across many stats symbols. These symbols provide a short and standardized way to represent statistical values, variables, formulas, tests, and mathematical operations.
Common examples include μ for the population mean, x̄ for the sample mean, σ for population standard deviation, s for sample standard deviation, and Σ for summation. Other symbols such as p, r, α, β, H₀, and Hₐ are used in probability, correlation, hypothesis testing, and statistical modeling.
Understanding these symbols makes statistics formulas much easier to read. This guide provides a practical reference to the most common statistical symbols, what they mean, how they are used, and examples of where you may encounter them.
Stats Symbols Quick Reference
The following table provides a quick overview of commonly used stats symbols.
| Symbol | Name | Common Meaning |
| μ | Mu | Population mean |
| x̄ | X-bar | Sample mean |
| σ | Sigma | Population standard deviation |
| σ² | Sigma squared | Population variance |
| s | S | Sample standard deviation |
| s² | S squared | Sample variance |
| n | Lowercase n | Sample size |
| N | Uppercase N | Population size |
| Σ | Capital sigma | Summation |
| p | P | Population proportion or p-value, depending on context |
| p̂ | P-hat | Sample proportion |
| r | R | Sample correlation coefficient |
| ρ | Rho | Population correlation coefficient |
| α | Alpha | Significance level |
| β | Beta | Type II error rate or model coefficient |
| H₀ | Null hypothesis | Hypothesis being tested |
| Hₐ | Alternative hypothesis | Competing hypothesis |
| SE | Standard error | Variability of an estimate |
| df | Degrees of freedom | Number of independent pieces of information |
| z | Z-statistic | Standardized test statistic |
| t | T-statistic | Statistic commonly used in t-tests |
| χ² | Chi-square | Chi-square statistic |
| F | F-statistic | Statistic used in ANOVA and other tests |
The meaning of a symbol can change depending on the statistical method. Therefore, always consider the formula and context in which a symbol appears.
What Are Stats Symbols?
Stats symbols are letters, Greek characters, and mathematical notation used to represent statistical concepts and values. They allow researchers, students, and analysts to communicate statistical information in a compact and consistent format.
For example, instead of repeatedly writing “population standard deviation,” a statistics formula can simply use σ.
Similarly, the phrase “sample mean” can be represented by x̄.
These symbols are especially useful in:
- Statistics formulas
- Probability calculations
- Research papers
- Data analysis
- Hypothesis testing
- Regression analysis
- Scientific studies
- Academic assignments
- Statistical software output
- Mathematical models
The terms stats symbols, statistics symbols, and statistical symbols are often used to describe this type of notation.
Why Are Statistical Symbols Important?
Statistics involves many variables and calculations. Using full words in every formula would make statistical notation difficult to read.
Symbols solve this problem by giving each concept a short representation.
For example, consider the formula:
x̄ = Σx / n
Instead of writing:
“Sample mean equals the sum of all observations divided by the number of observations,”
the entire idea can be represented with a short mathematical expression.
Statistical symbols also make formulas easier to compare across textbooks, research papers, and academic subjects.
Mean and Average Symbols
The mean, commonly called the average, is one of the most frequently used statistical concepts.
Population Mean: μ
The Greek letter μ (mu) commonly represents the population mean.
A population mean is the average value calculated from an entire population.
For example, if a researcher has information about every student in a school and calculates their average age, that population average may be represented by μ.
A population mean can be written as:
μ = ΣX / N
Here:
- μ = population mean
- ΣX = sum of all population values
- N = population size
Sample Mean: x̄
The symbol x̄, pronounced “x-bar,” commonly represents the sample mean.
A sample mean is the average calculated from a sample rather than the entire population.
The formula is:
x̄ = Σx / n
Here:
- x̄ = sample mean
- Σx = sum of sample values
- n = sample size
For example, if five students have test scores of 60, 70, 80, 90, and 100, their sample mean is:
x̄ = 400 / 5 = 80
Standard Deviation Symbols
Standard deviation describes the spread or variability of data around its mean.
Population Standard Deviation: σ
The symbol σ (sigma) is commonly used for population standard deviation.
A small standard deviation generally means that observations are relatively close to the mean, while a larger standard deviation indicates greater spread.
For example, if two groups have the same average income but one group has a much larger σ, the incomes in that group are more widely dispersed.
Sample Standard Deviation: s
The letter s commonly represents sample standard deviation.
It is used when the available data represent a sample of a larger population.
The distinction between σ and s is important:
- σ → population standard deviation
- s → sample standard deviation
The exact notation may vary by textbook or statistical discipline.
Variance Symbols
Variance is another measure of data variability.
Population Variance: σ²
The symbol σ² represents population variance.
It is related to population standard deviation by:
σ = √σ²
Because variance uses squared deviations, its units are squared compared with the original measurement.
Sample Variance: s²
The symbol s² commonly represents sample variance.
It is related to sample standard deviation by:
s = √s²
Understanding the relationship between variance and standard deviation is important when reading statistical formulas.
The Summation Symbol: Σ
The capital Greek letter Σ (sigma) represents summation.
It means that a series of values should be added together.
For example:
Σx
means the sum of all x values.
A more detailed expression may look like:
Σxᵢ
where xᵢ represents individual observations.
The summation symbol appears in many statistics formulas, including formulas for:
- Mean
- Variance
- Standard deviation
- Regression
- Correlation
- Other statistical calculations
It is important not to confuse Σ with σ. The capital Σ generally means summation, while lowercase σ commonly represents population standard deviation.
Sample Size and Population Size Symbols
Sample Size: n
The lowercase letter n commonly represents sample size.
If a survey includes 500 participants, for example:
n = 500
This means the sample contains 500 observations or participants.
Population Size: N
The uppercase letter N often represents population size.
For example, if a population contains 10,000 individuals:
N = 10,000
The use of n for a sample and N for a population is common, although notation can vary depending on the source.
Proportion Symbols
A proportion represents a fraction of observations or individuals with a particular characteristic.
Population Proportion: p
The lowercase p is commonly used for a population proportion.
For example, if 60% of a population has a certain characteristic:
p = 0.60
However, p can also refer to a p-value in hypothesis testing. The context determines its meaning.
Sample Proportion: p̂
The symbol p̂, pronounced “p-hat,” commonly represents a sample proportion.
It can be calculated as:
p̂ = x / n
where:
- x = number of observations with the characteristic
- n = total sample size
The hat over p indicates that the value is an estimate based on sample data.
Correlation Symbols
Correlation measures the strength and direction of a relationship between variables.
Sample Correlation: r
The symbol r commonly represents a sample correlation coefficient.
For Pearson correlation, its value generally ranges from -1 to +1.
Examples include:
- r = +1 → perfect positive linear relationship
- r = 0 → no linear correlation
- r = -1 → perfect negative linear relationship
Values between these points describe different degrees of linear association.
Correlation should not automatically be interpreted as proof that one variable causes another.
Population Correlation: ρ
The Greek letter ρ (rho) commonly represents the population correlation coefficient.
The basic distinction is:
- r → sample correlation
- ρ → population correlation
Hypothesis Testing Symbols
Hypothesis testing uses a set of symbols to describe statistical assumptions and conclusions.
H₀: Null Hypothesis
H₀, read as “H-zero,” represents the null hypothesis.
The null hypothesis generally describes a specified baseline condition, such as no difference or no effect, depending on the test.
For example:
H₀: μ = 50
This states that the population mean is 50 under the hypothesis being tested.
Hₐ or H₁: Alternative Hypothesis
Hₐ or H₁ represents the alternative hypothesis.
It describes the alternative condition being investigated.
For example:
Hₐ: μ ≠ 50
This represents a two-sided alternative in which the population mean differs from 50.
Alpha Symbol: α
The Greek letter α (alpha) commonly represents the significance level in hypothesis testing.
A commonly selected value is:
α = 0.05
The significance level is part of the decision rule used when conducting a statistical test.
It is important to distinguish α from the p-value. They are related to hypothesis-testing decisions but are not the same thing.
Beta Symbol: β
The symbol β (beta) can have different meanings in statistics.
In hypothesis testing, β is commonly associated with a Type II error.
A Type II error occurs when a statistical test fails to reject a null hypothesis that is false, according to the specified testing framework.
In regression and statistical modeling, β can instead represent a model parameter or regression coefficient.
Therefore, the meaning of β should always be determined from its context.
P-Value Symbol: p
The lowercase p is commonly used to represent a p-value.
A p-value is calculated under the null hypothesis and the assumptions of the statistical test. It measures how unusual the observed result, or a result more extreme than it, would be if the null hypothesis and model assumptions were correct.
For example:
p = 0.03
A p-value should not be described simply as the probability that the null hypothesis is true. Its interpretation depends on the statistical test and study design.
The symbol p can also represent population proportion, so context is important.
Standard Error: SE
SE stands for standard error.
Standard error describes the variability of a statistic across repeated samples under a specified sampling process.
For a sample mean, a commonly used formula is:
SE = s / √n
where:
- SE = standard error
- s = sample standard deviation
- n = sample size
As sample size increases, the standard error of a sample mean generally decreases when other conditions remain comparable.
Degrees of Freedom: df
df means degrees of freedom.
Degrees of freedom are used in many statistical procedures, including:
- t-tests
- Chi-square tests
- ANOVA
- Regression
- Variance calculations
For a one-sample t-test, degrees of freedom are commonly:
df = n – 1
The correct degrees of freedom formula depends on the statistical procedure being used.
Z-Score and Z-Statistic: z
The lowercase z commonly represents a z-score or z-statistic.
A z-score indicates how many standard deviations an observation is from a mean.
A common formula is:
z = (x – μ) / σ
where:
- x = observed value
- μ = population mean
- σ = population standard deviation
For example, a z-score of 2 means an observation is two standard deviations above the mean, assuming the standard z-score definition applies.
T-Statistic: t
The symbol t is commonly used for a t-statistic.
T-statistics are frequently used in situations involving estimated means and unknown population standard deviations, including various t-tests.
A t-statistic can be compared with a relevant t-distribution when performing a statistical test.
The exact formula depends on the type of t-test being conducted.
Chi-Square Symbol: χ²
The Greek symbol χ², pronounced “chi-square,” represents the chi-square statistic.
Chi-square procedures are commonly used for categorical data.
Applications include:
- Tests of independence
- Tests of association
- Goodness-of-fit procedures
- Analysis of categorical frequency data
The exact interpretation depends on the specific chi-square test.
F-Statistic: F
The letter F commonly represents an F-statistic.
F-statistics are used in several statistical procedures, including analysis of variance (ANOVA) and certain regression tests.
In ANOVA, the F-statistic compares variation between groups with variation within groups according to the model being tested.
Common Stats Symbols in Regression
Regression analysis uses several important symbols.
Dependent Variable: y
The letter y commonly represents the dependent or response variable.
Independent Variable: x
The letter x commonly represents an independent or explanatory variable.
Intercept: β₀
In a population regression model, β₀ commonly represents the intercept parameter.
Slope: β₁
β₁ commonly represents the slope parameter for a predictor in a simple linear regression model.
Error Term: ε
The Greek letter ε (epsilon) is commonly used to represent an error or disturbance term in a statistical model.
A simple regression model may be written as:
y = β₀ + β₁x + ε
This equation describes a relationship between a response variable, an explanatory variable, model parameters, and an error term.
Confidence Interval Symbols
A confidence interval provides an interval estimate constructed using a specified statistical procedure and confidence level.
A simplified expression can be written as:
Estimate ± Margin of Error
For a sample mean, an interval may involve:
x̄ ± critical value × SE
The exact critical value depends on the statistical method and assumptions.
Common confidence levels include:
- 90%
- 95%
- 99%
A confidence interval should be interpreted according to the method used to construct it rather than simply as a probability statement about a fixed parameter.
Difference Between Similar Stats Symbols
Some statistics symbols look similar but have different meanings.
σ vs Σ
These are both Greek sigma symbols but serve different purposes.
- σ = commonly population standard deviation
- Σ = summation
For example:
σ = 5
means the population standard deviation is 5.
Meanwhile:
Σx
means to add the x values.
σ vs s
These commonly distinguish population and sample standard deviation.
- σ = population standard deviation
- s = sample standard deviation
x̄ vs μ
Both represent means, but they usually refer to different groups.
- x̄ = sample mean
- μ = population mean
r vs ρ
These commonly represent correlation coefficients for different levels.
- r = sample correlation
- ρ = population correlation
n vs N
These often distinguish sample size from population size.
- n = sample size
- N = population size
Symbols vs Statistical Abbreviations
Not everything found in a statistics formula is technically a mathematical symbol.
For example:
- μ is a statistical symbol.
- σ is a statistical symbol.
- Σ is a mathematical symbol used extensively in statistics.
- SE is an abbreviation for standard error.
- df is an abbreviation for degrees of freedom.
- CI is an abbreviation for confidence interval.
People may search for all of these using phrases such as stats symbols, statistics notation, or statistical symbols, so a useful reference should cover both symbols and commonly encountered abbreviations.
How to Read Stats Symbols in a Formula
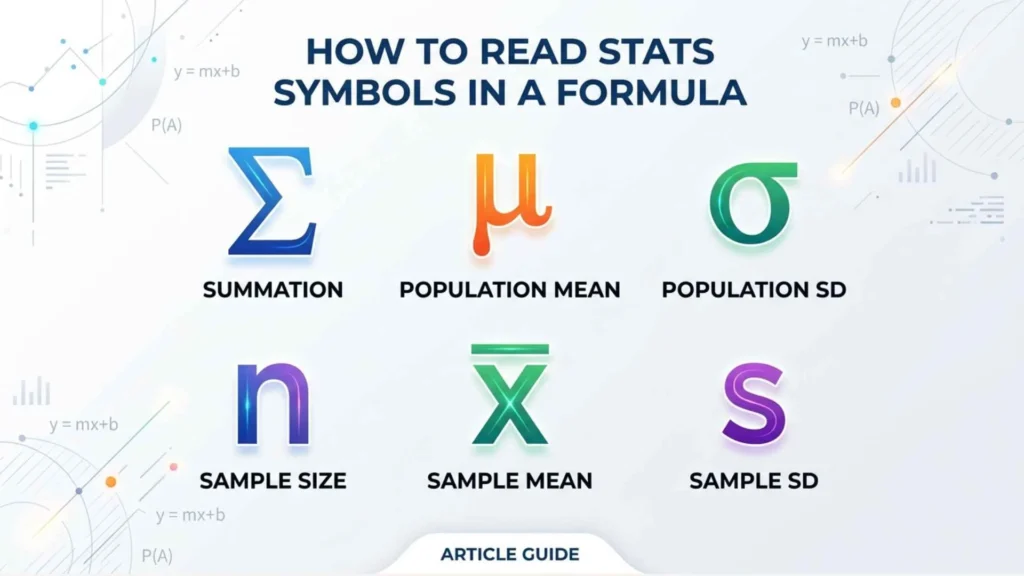
The easiest way to understand a statistical formula is to identify each symbol separately.
Consider:
x̄ = Σx / n
Start with x̄. It represents the sample mean.
Next, Σx means the sum of the sample observations.
Finally, n represents the sample size.
Therefore, the formula means that the sample mean is calculated by adding the sample values and dividing the result by the number of observations.
This approach can be applied to more complicated formulas as well.
Stats Symbols Cheat Sheet
For quick study or revision, remember these frequently used symbols:
- μ — population mean
- x̄ — sample mean
- σ — population standard deviation
- s — sample standard deviation
- σ² — population variance
- s² — sample variance
- Σ — summation
- n — sample size
- N — population size
- p — population proportion or p-value, depending on context
- p̂ — sample proportion
- r — sample correlation
- ρ — population correlation
- α — significance level
- β — Type II error rate or model parameter
- H₀ — null hypothesis
- Hₐ — alternative hypothesis
- SE — standard error
- df — degrees of freedom
- z — z-score or z-statistic
- t — t-statistic
- χ² — chi-square statistic
- F — F-statistic
- ε — error term
Frequently Asked Questions About Stats Symbols
What are stats symbols?
Stats symbols are standardized letters, Greek characters, and mathematical notation used to represent statistical concepts, variables, values, and calculations. Examples include μ, σ, x̄, s, n, p, r, and Σ.
What does μ mean in statistics?
μ (mu) commonly represents the population mean, which is the average value of an entire population.
What does σ mean in statistics?
σ (sigma) commonly represents the population standard deviation. It describes the spread of population values around the population mean.
What does x̄ mean in statistics?
x̄, pronounced “x-bar,” commonly represents the sample mean. It is the average calculated from sample data.
What does Σ mean in statistics?
Σ (capital sigma) represents summation. It tells you to add a series of values together.
What does n mean in statistics?
The lowercase n commonly represents sample size, meaning the number of observations included in a sample.
What is the difference between σ and s?
σ commonly represents population standard deviation, while s commonly represents sample standard deviation.
What does r mean in statistics?
r commonly represents a sample correlation coefficient, particularly the Pearson correlation coefficient.
What does p mean in statistics?
The symbol p can have different meanings. It commonly represents a p-value in hypothesis testing or a population proportion in other statistical contexts.
What does H₀ mean in statistics?
H₀ represents the null hypothesis. It describes the baseline hypothesis being evaluated by a statistical test.
What does α mean in statistics?
α (alpha) commonly represents the significance level selected for a hypothesis test.
Why do statistics use Greek letters?
Greek letters provide a compact and standardized way to represent population parameters and other mathematical concepts. They are widely used across statistics, mathematics, science, and research.
Final Thoughts on Stats Symbols
Learning stats symbols is one of the easiest ways to become more comfortable with statistics. Once you understand the most common notation, formulas that initially look complicated become much easier to interpret.
Start with the core symbols such as μ, x̄, σ, s, n, N, Σ, p, r, and α. Then learn the symbols associated with hypothesis testing, probability, regression, and statistical tests.
The most important thing to remember is that a symbol does not always have one universal meaning. Symbols such as p, β, and F can represent different concepts depending on the statistical method and context. Always check the surrounding formula, definitions, and study design before interpreting a symbol.
With this reference, you can quickly identify common statistical notation and use it more confidently when studying, analyzing data, or reading research.

 Lisa Reynolds
 John Carter